
This is a Buyers' Strike
Between the Lines - Vol. 3

Cleaner but not clear. That’s how I’d describe it. I think one of the laziest words in markets right now is capitulation. Everyone is very keen to throw it about because the tape has felt awful, and awful is comforting when you are looking for a turning point. I do not think that is what this has been at all. This has been de-risking without surrender. There is a real difference.
Capitulation is broad and is when people stop pretending different tickers equal different risks. Correlation jumps, gross gets clipped properly and the market stops caring what you own because all anyone wants is less of it. I don’t think this has really looked like that. It has looked more like a market where people have brought net down, added hedges, trimmed exposure, and still refused to fully let go of the longs they think they will want back the moment the headlines calm down. This is what has made this market feel so awkward.
There has been a solid amount of pain, but the structure underneath it has been very different from a true washout. A lot of systematic selling had already happened. People’s books are a lot cleaner than they were entering the month of March but sadly cleaner does not mean healed.
Once a market gets this hedged, you don’t necessarily need great news to get a sharp move the other way. You just need less bad news - be that lower oil, slightly calmer rates, a pause/slowdown in headlines. Even a simple absence of fresh sellers can be enough when people are leaning on shorts, gamma is unstable, and nobody really trusts the downside as much as they did a week ago.
Macro remains very much in control for now, with oil and rates setting the tone. Growth expectations still have not taken the kind of hit that usually comes with more durable lows. But I’d argue you’re seeing some change in growth pricing when you look at the front-end of the curve… see SFRH7 the trade I recently put on and shared with subscribers which is up 20bps from where we entered.
I think where we are the easiest way to look at this market is one that has reduced risk without fully giving up, which is exactly why the next move can be bigger, faster and much harder to trust.
CTAs are finally relevant. I know I haven’t spoken about them for a while, and there was a reason for that - for most of the past year, they were just passengers (as they should have been), adding to a trend that was already working. Now they do matter, and I think this is where it gets interesting and is one of the most underappreciated dynamics right now.
Over the past month, this small cohort has sold roughly $184B of global equities and is now short in a meaningful fashion according to GS flow estimates. In US equities specifically, they are estimated to be short ~$28B S&P. When you go from long, to getting stopped out, to running negative momentum signals across multiple lookback periods, the character of the selling does change.
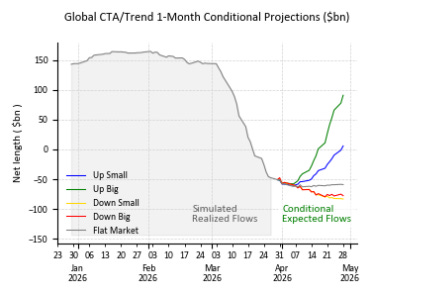
I think the supply that has been driving this move a lot is approaching exhaustion. GS modelled flows forecast that only a few billion dollars of selling over the next week under a flat tape, against the tens of billions per week we have seen through March. That deceleration is substantial and changes the market dynamic even before you think about the upside case.
On an up tape - CTAs flip from sellers to buyers with $142B of demand sitting in the wings if price cooperates. I would like to be clear on this though. I am not particularly enthused about this asymmetry because the critical word is if. You actually need an up tape to trigger it. The 142B does not show up because positioning is extreme. It shows up because price moves first, and the momentum signals respond to that. Conditional flows are conditional.
It is also worth remembering that this asymmetry is nothing special despite the expected number being in the top %iles. We had the exact reverse of this setup during the 2025 rally. CTAs were huge buyers on the way up, adding fuel to a move that was already working and would have been enormous sellers on any meaningful down tape at that time. That is simply how trend following works. Large buying on up tapes and large selling on down tapes - pretty standard for the community.
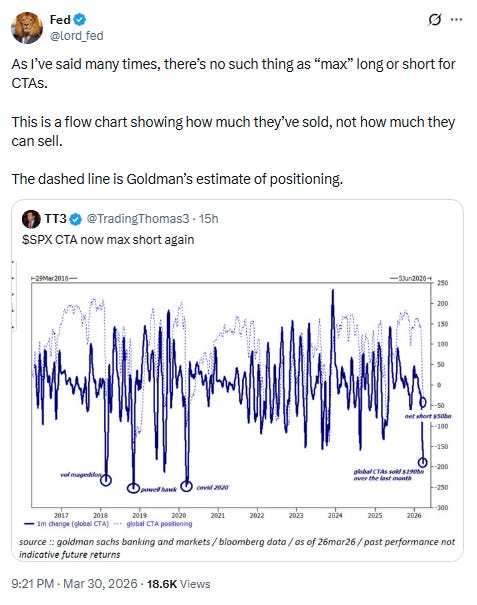
Something circulating right now that I want to address directly, because it is leading people to draw the wrong conclusions from the positioning data. You will have seen it on X… “CTAs now max short”. The implication being that CTAs have hit some kind of capacity ceiling and that they literally cannot sell anymore, thus a violent reversal is imminent. I pushed back on it later night and I want to explain it properly
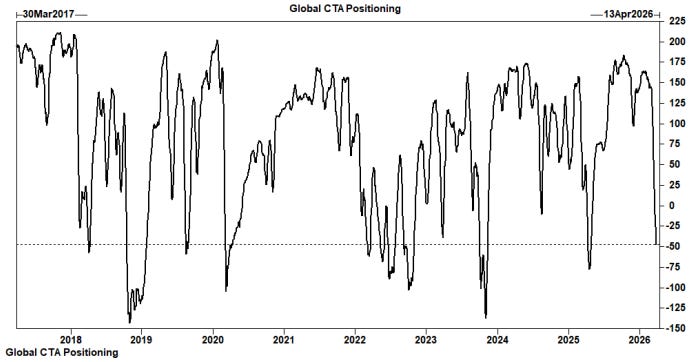
The percentile ranking that banks publish alongside CTA positioning data is a lookback, not a capacity signal. When GS or Morgan Stanley flag that CTA equity exposure is at the 99th percentile on a five year lookback, all that means is that current positioning is as extreme as the model has observed over that window. It does not mean that CTAs are out of ammunition. It does not mean that they are physically unable to add to the position. The models are not pegged to industry AUM, but momentum signals. If the momentum signals push further negative, the models respond. The positioning can go further from the historical distribution suggest, because history is not a constraint on future behaviour. Another point worth understanding is that the percentile ranking is not scaled to the actual size of the CTA industry. A reading of “max short” today may translate into a very different notional dollar exposure than the last time the same %ile was observed. A 99th %ile short in 2026 may represent more notional than a 99th %ile in 2021. The %ile simply tells you about signal intensity relative to history and tells you very little about flow capacity that sits behind it.
What the extreme percentile does tell you, however, and this is worth taking seriously, is something about the asymmetry of moves from here. At positioning extremes there is simply less room to add in the same direction and can signal that the trend is becoming exhausted. A “max short” reading does not mean the short cannot get bigger, but it does mean the marginal signal required to add further is harder to generrate than it would be from a more neutral starting point. It is not the same as the market being about to rip, but is a real structural consideration when thinking about how future price action might interact with CTA flows.
The honest framing is that the extreme positioning is relevant context for thinking about the conditional flow picture and what could happen. It is not by itself a catalyst.
I have said all of this before. Not a new position for me. In Sept 2025, when CTAs were on the other end of this, the same language was doing the rounds. “CTAs are max long” - same implication just opposite direction.
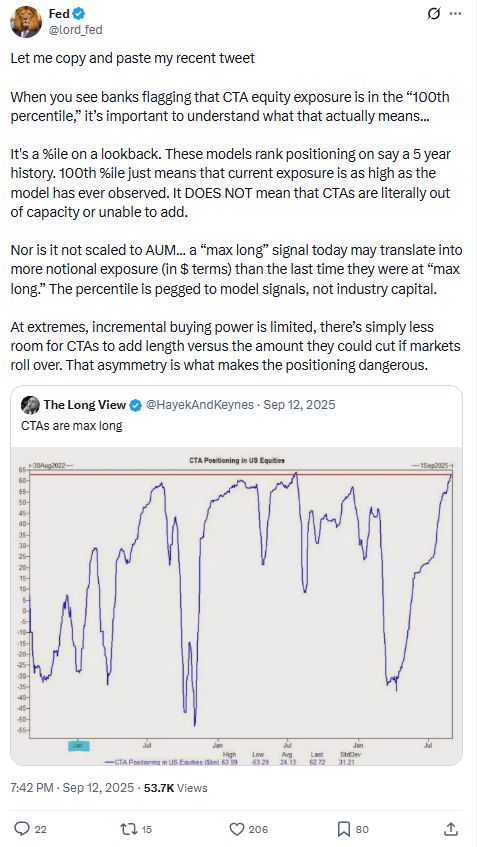
Percentile rankings are lookback observations, not capacity limits. Models are pegged to signals. At extremes, the asymmetry shifts but capacity does not disappear. The incremental buying power is limited when you are already heavily long, but that is a statement about the risk/reward of the position, not about whether CTAs can add. Ya di ya da. What made this moment worth paying attention to was not that CTAs were “max long” and therefore due to reverse. It was that the positioning asymmetry at that level meant the potential energy from this cohort on the downside was disproportionately large relative to the remaining upside fuel. If markets rolled over from that point, the unwind would have been huge (similar to what we have seen recently).
So. Similar to now… The energy will only convert into actual market force if price gives the signals something to respond to. The machine does not move because the %ile on Goldmans models lookback is extreme. It moves because price moves first. That is the part that keeps getting lost in these “max short” tweets floating around. Positioning is a loaded spring, not a self-releasing mechanism.
