
From Zero to FX Hero
An unapologetically deep guide to FX

In the time it takes to read this sentence, over $300 million in currencies will change hands worldwide. Welcome to the world of FX trading, where global currencies never sleep. With over $7 trillion changing hands daily, it's the largest and most liquid market out there. Whether you're just starting to trade currencies or you're keeping tabs on FX for work, this market always has something new to teach.
Why FX matters? Simple - currencies make international trade and finance possible. They move due to economic forces, capital flows, and the decisions made by central banks. When you get why currencies move, you understand the global economy better and can make smarter trades or business decisions.
I'll start with what really drives currency values - interest rates and central bank decisions. Then I'll decode FX jargon (yeah, those "pips" everyone talks about). We'll explore everything from basic spot trades to complex options. We'll also tackle volatility - why some currency pairs bounce all over the place while others barely move.
For strategy, I'll break down the carry trade and how it connects to global risk appetite and volatility. We'll look past day-to-day prices to figure out a currency's actual value using concepts like purchasing power parity. And since emerging market currencies play by different rules, we'll spend time on what makes them tick.
For those wanting an insider's view, I'll share what pros focus on - market liquidity at different hours, positioning data, and those seasonal patterns that keep showing up. We'll delve into the role of policy and politics, how central banks intervene in markets, what happens with fixed exchange rates, and when "management" becomes "manipulation." I'll also cover some technical aspects most people miss, like cross-currency basis and overnight rollovers (tom/next).
I got started in FX trading with a focus on G10, primarily Scandi crosses. What hooked me was how FX makes you think in layers. You can't just stare at charts - you need to understand capital flows, central bank thinking, and market sentiment. It's real-time macro analysis but has become increasingly technical. This post isn't some academic overview - it's stuff I wish someone had explained to me when I started. No unnecessary jargon, not dumbed down, just a clear roadmap of how things actually work.
Risk disclaimer: This post may cause increased caffeine intake, spontaneous chart pulling, and the urge to tell people, “it’s all about real yields.” Proceed with coffee.
The Drivers of FX: Interest Rates, Capital Flows, and Central Banks
Many ask, what makes one currency strengthen against another? At its core, an exchange rate is like a price that balances supply and demand between two currencies. If more people want dollars and fewer want euros, the price of dollars (in euros) goes up. But what really influences that supply and demand? Let's break down three of the most important drivers of FX values:
Interest Rates: The Magnetic Pull of Yield
Interest rates are often the headline act in currency movements, as you might have seen with USD/JPY over the past few years. In simple terms, money tends to flow where it earns the best return. If interest rates in the U.S. rise relative to Europe, holding money in USD becomes more attractive than holding it in EUR. As a result, demand for USD could increase, pushing USD higher against the EUR. This is known as the interest rate differential - the gap between two countries’ interest rates, and it's a key factor in many FX strategies.
However, it's not just the current interest rates that matter, but also the expected future rates. FX markets are always looking ahead as are all markets. If traders believe a central bank will hike rates in the coming months, they might start buying that currency in anticipation. In contrast, if a country is cutting rates or has very low yields, its currency might weaken as investors seek better returns elsewhere.
Importantly, high interest rates can strengthen a currency only up to a certain point. If rates are high because inflation is out of control or the economy is unstable, investors may shy away despite the yield. It's the real interest rate (the interest rate minus inflation) and the perceived risk that truly matter. A stable economy with moderately higher rates is a magnet for capital, whereas an unstable one with high rates might actually see its currency fall.
After Covid came the hiking cycle. The Fed got ahead of the curve faster and more forcefully than most developed market central banks, making the greenback the yield and duration king almost overnight. Rate differentials widened, capital flowed in, and the dollar surged - not just as a safe haven, but as a high-yielder, too. That rare combination made the greenback untouchable through much of 2022, especially against currencies like the yen, yuan and the euro, where rate differentials grew and grew. It wasn’t just fear, it was fundamentals.

Capital Flows: Money on the Move
Currencies are also driven by capital flows – the movement of money across borders for investment. Imagine global investors deciding to pour money into a country’s stock market or real estate. To invest there, they first need to buy that country’s currency, boosting its demand. Conversely, if investors pull money out, perhaps due to fear or better opportunities abroad, they sell that currency, increasing supply and potentially pushing its value down.
Capital flows can be driven by many factors: economic growth prospects, geopolitical stability, corporate earnings, or even the commodity sector. For example, if Country A discovers huge oil reserves and energy companies invest heavily there, new capital flows can strengthen Country A’s currency. On the other hand, if Country B is experiencing political turmoil and investors fear their assets aren't safe, capital might flee Country B, weakening its currency.
One aspect of capital flows is the balance of payments – which includes the trade balance (exports minus imports) and financial flows. A country running a large trade surplus (exporting more than it imports) is steadily accumulating foreign currency in exchange for its goods, which can support its currency. Meanwhile, a country that relies on foreign borrowing or investment to fund its deficits might see its currency come under pressure if those inflows dry up.
Global risk appetite also plays a role. In risk-on environments, investors tend to send money abroad in search of higher returns, which can boost riskier currencies. In risk-off moments, when fear prevails (such as during a financial crisis), investors often return to perceived safe-haven currencies, including the U.S. dollar, Japanese yen, or Swiss franc. These flow shifts can cause broad FX moves unrelated to interest rates per se but tied to overall sentiment.
Central Bank Policy and Expectations
Central banks are the orchestrators behind interest rates (I mean, they’re not, but that’s another story), but their influence on FX goes beyond just setting a policy rate. When a central bank like the Fed or the European Central Bank (ECB) shifts its stance, currency markets react. If a central bank signals it will tighten monetary policy (raising rates or otherwise making money scarcer), it's generally bullish for the currency, as discussed. However, the reverse is also true, a dovish shift (rate cuts or QE) can weaken a currency.
Beyond rates, central banks influence FX through open market operations and guidance. Massive bond-buying programs (QE) after the 2008 financial crisis, for instance, injected liquidity and often weakened those currencies by design as part of an effort to stimulate growth. Likewise, when a central bank winds down stimulus or reduces its balance sheet, it can provide a lift to the currency as we saw in the past few years during the hiking cycle.
It's also about communication. Modern central banking involves a lot of signalling to shape market expectations. If the Bank of England hints that rate hikes are coming, traders might bid up the pound even before anything actually changes. On the other hand, if a central bank expresses concern about the currency being too strong (perhaps because it's hurting exporters), the market may interpret that as a signal that the bank might cut rates or intervene, and the currency could soften.
In a nutshell, currencies are influenced by the push and pull of interest rate differentials, the ebb and flow of capital across the globe, and the actions (and words) of central banks. Of course, many other factors, such as political stability, growth, and trade, also contribute to these main drivers. However, understanding these core dynamics provides a framework for understanding why FX rates move the way they do. So next time you see a sharp move in a currency, you’ll most likely be able to trace it back to one of these top three factors.
Pips and Lots
Pips: A pip is the standard unit to measure how much a currency pair has moved. Most major currency pairs are quoted to four decimal places (e.g., EUR/USD = 1.1000). In those cases, one pip is a movement in the fourth decimal place, or 0.0001. So if EUR/USD rises from 1.1000 to 1.1050, we say it moved 50 pips. For pairs involving the Japanese yen, which are often quoted to two decimal places (like USD/JPY = 110.00), one pip is 0.01. Pips give traders a convenient way to talk about price changes without getting lost in a string of decimals.
Lots and Position Size: Currencies are traded in specific amounts called lots. A standard lot in FX trading is typically 100,000 units of the base currency (the first currency in the pair). For example, if you place a trade of 1 lot on EUR/USD, you're effectively buying or selling €100,000 against U.S. dollars. It’s important to realise that the pip value (how much money you gain or lose per pip move) depends on your lot size. Using the EUR/USD example, a 1 pip move on a 1 lot position is roughly $10 in profit or loss. If you traded 0.1 lot (10,000 units), one pip would be about $1.
Spot, Forwards, Swaps, Futures: The Instruments of FX Trading
Now that you know the basic lingo, let's look at the various instruments or products through which FX is traded. Not all FX trading is just buying and selling currency for immediate exchange; there are forward-looking instruments and derivatives too. Each serves different needs, from immediate currency conversion to hedging future risk or speculating on price moves. Here are the main ones:
Spot FX
When people talk about trading FX, the spot market is often what they mean. A spot FX trade is a simple currency exchange agreement – you agree to exchange one currency for another at the current market price, with the exchange (settlement) typically happening in two business days. For example, if you buy EUR/USD on the spot market, you're buying euros with U.S. dollars, and in two days you deliver the USD and receive the euros.
In practice, retail traders and many institutions don't actually want to take delivery of the currency; they're trading for speculative or hedging purposes. Brokers and trading platforms handle the mechanics so that if you hold a position overnight, it's seamlessly “rolled” (more on that later) rather than you receiving a pile of foreign cash in your bank account. The spot price you see is determined by the interbank market , major banks quoting prices to each other, which in turn is influenced by all the factors we discussed (interest rates, flows, etc.). Spot FX is 24/5, meaning trading is continuous from the Monday morning open in Asia (Sunday night in Europe/US) until Friday evening close in New York.
Forward Contracts
A forward FX contract is an agreement to exchange a set amount of one currency for another at a future date, at a price (exchange rate) agreed upon today. Unlike spot, which settles right away (T+2 days), a forward can be for any maturity date out to years in the future. For example, a company might know it needs to pay 1 million euros in six months for a purchase. Worried that the euro might become more expensive versus the dollar by then, the company can lock in today’s rate by selling USD and buying EUR forward for delivery in six months. Come settlement day, they exchange at that fixed rate, regardless of where the spot market is.
The forward price is not a guess of where the currency will be in the future; it's mechanically derived from the current spot rate adjusted for the interest rate differential between the two currencies over the period. This is due to something called covered interest parity, which in theory keeps the forward price in line with interest rates so there's no arb. If one currency has a higher interest rate than the other, its forward price tends to be weaker (trading at a discount) relative to the other currency’s forward price. Essentially, any interest advantage is offset by a forward price disadvantage and vice versa. For instance, if the U.S. dollar has higher interest rates than Japan, USD/JPY forward quotes will be slightly lower (fewer JPY per USD) than the spot price, reflecting the interest that accrues on JPY versus USD over time.
Forwards are very useful for hedging and for any scenario where you need to deal with a future exchange. They are usually traded over-the-counter (OTC) between parties (like a company and a bank), and they can be customised in amount and maturity. Most large corporate FX transactions are done via forwards to eliminate the uncertainty of future exchange rates.
FX Swaps
An FX swap is a clever combination of a spot and a forward. It involves two exchanges: one currency is swapped for another on the spot date (near leg) and then swapped back on a forward date (far leg) at a pre-agreed rate. In essence, it's like temporarily exchanging money and then reversing that exchange later.
Why use an FX swap? One common use is for financing or rolling positions. Say a bank holds a large amount of euros but needs dollars for the next month (perhaps a client needs a dollar loan). The bank can do an FX swap: it will swap euros for dollars today (spot leg, effectively borrowing dollars against euros), and simultaneously agree to swap dollars back for euros in one month at a set rate (forward leg). This way, the bank gets the dollars it needs now and will return them later, paying a rate embedded in the forward price. That rate difference reflects the interest rate differential for the one-month period (the cost of borrowing one currency vs the other).
FX swaps are extremely popular among banks and large institutions for managing short-term liquidity in different currencies.
Currency Futures
Futures are another way to trade currency for future delivery, but unlike forwards, they are standardised and exchange-traded. A currency future is a contract (traded on exchanges like the CME) that specifies an amount of currency to be exchanged on a set future date, with the price agreed today. For example, there’s a futures contract for 125,000 euros priced in USD (trading as the euro futures). If you buy that futures contract, you're agreeing to buy 125,000 EUR and sell the equivalent USD at the futures price when the contract expires.
Because they trade on exchanges, futures have some differences: they are marked-to-market daily (meaning profits or losses are settled each day), and you have to post margin to a clearinghouse, which manages counterparty risk. Some traders prefer futures for the transparency and centralised clearing, while others prefer forwards/spot for the flexibility and lack of exchange fees. Futures prices track the same dynamics of interest differential as forwards do (the futures price will incorporate the interest rate gap between currencies). In fact, for major currencies, futures prices are usually very close to the corresponding forward prices available OTC.
FX Options (Overview)
I’m sure you already understand what an option is, but to just have it jotted down. Options give you the right, but not the obligation, to exchange currency at a certain rate by a certain date. They are a bit more complex than the straightforward buy/sell of spot and forwards, so I’ll dedicate the next section to them in detail. But in brief, an FX option might be used by a company to insure against a worst-case exchange rate, or by a trader to speculate on a big move without risking more than the premium paid.
FX options can be tailored OTC or traded on exchanges (there are options on currency futures, for example). They introduce concepts like volatility into the mix because the option's value depends not just on where the exchange rate is, but how much it might move. We’ll explore the world of options next, including different styles of options and how large options positions can actually influence the spot market itself.
The World of FX Options - Styles, Expiries, and Market Impact
FX options add another layer of sophistication to currency trading. Unlike spot or forwards where you have to exchange currencies at the agreed time, an option gives you a choice. This flexibility makes options powerful for hedging and speculation, especially when you're concerned about volatility. Let’s break down key aspects of FX options:
Vanilla Options: European vs. American
In FX (as in other markets), a call option gives the holder the right (but not the obligation) to buy a currency at a specified rate (the strike price) by a certain date. A put option gives the right to sell a currency at the strike by that date. The buyer pays a premium up front for this right, while the seller (writer) receives the premium and takes on the obligation to fulfil the trade if exercised.
“European” and “American” in this context have nothing to do with geography; they just refer to when the option can be exercised. A European-style option can only be exercised at the time of expiry. An American-style option can be exercised at any time up to and including the expiry date. In FX markets, most OTC vanilla options are effectively European style - partly because it's cleaner to price and hedge, especially in cash-settled markets. Exchange-traded options on currency futures are more often American style, in line with broader futures conventions.
For example, say you buy a European call option on GBP/USD with a strike of 1.3000 expiring in one month. If, at expiry, GBP/USD is trading at 1.3200, you can exercise the option and buy pounds at 1.3000 (cheaper than the market rate) - or more likely, just take the cash-equivalent payout. If GBP/USD is below 1.3000, the option expires worthless.
From the dealer’s side, the key is hedging. Even though a European option can’t be exercised early, its value still changes every tick - which means the dealer needs to hedge the directional risk as the market moves. This is where delta hedging comes in. If a dealer is short a call, they’ll typically hedge by buying the underlying currency - in this case, buying GBP/USD spot or forward. As spot moves and the delta of the option shifts, they adjust the hedge dynamically. This is true whether the option can be exercised early or not, the option’s price and delta move continuously, and that’s what matters for managing risk.
Exotic Options: Barriers and Digitals
The FX options market has a rich array of exotic options, tailored to specific needs or views. Two common exotic types in FX are barrier options and digital options:
Barrier Options: These are options that activate or extinguish based on the underlying currency crossing a certain price level (the barrier). A knock-in option only comes into existence (becomes “alive”) if the underlying hits a certain barrier price. A knock-out option, on the other hand, dies (expires worthless) if the underlying hits the barrier. For example, an exporter might buy a knock-out call option on USD/JPY that knocks out if USD/JPY falls below a certain level, allowing them to pay a lower premium than a regular call – but with the risk that if USD/JPY really plummets, their option goes away. Barriers are popular in FX hedging and speculation because they can be structured to reduce upfront cost or to pay off extra in certain scenarios, but they add a layer of path-dependency (the path the price takes matters, not just where it ends up).
Digital Options: Also known as binary options (in the institutional sense, not the gambling-type platforms but actual OTC binaries), these pay a fixed amount if the underlying is above or below a certain level at expiration. Essentially, it's a yes/no bet. For instance, a digital option could pay $1,000,000 if EUR/USD is above 1.2000 on December 31, and pay nothing if not. Traders use these to express views like “I think this level will be broken by this date” with a fixed payoff. The pricing of digital options is closely tied to the perceived probability of that event, which in turn is influenced by volatility.
There are many other exotic variations (double barriers, range options, Asian options that average the price, etc.), but barriers and digitals are among the most commonly traded in FX. They often come up in market chatter (research reports for the lifetime subscribers), especially when big barrier levels in the market might influence behaviour ("There's reportedly a big knock-out option at 1.20, so the market might struggle to break above that level").
Option Expiries and the FX Option Market
Unlike stock options that may expire on a set schedule (such as the third Friday of the month) or options that trade on an exchange with daily expiries, the OTC FX option market allows for almost any expiry date. That said, certain expiries are more common and liquid, such as 1 week, 1 month, 3 months, 6 months, and 1 year, among others. When we refer to a "1M option" we mean an option expiring one month from now. A lot of interbank option trading and hedging focuses on these standard tenors.
Another convention: expiry time. Many OTC FX options expire at 10 a.m. New York time (which is known as the "NY cut") on the expiration date. This is a commonly used cutoff, meaning if you have a EUR/USD option expiring Thursday, it likely ceases trading at 10 a.m. NY that day, and the final settlement is based on a reference price around that time. Exchange-traded options on futures will have whatever time the exchange specifies (and often align with futures settlement times). Knowing the exact expiration time matters if you're trading around an expiry, as the option's influence on the market might vanish abruptly after that point.
How Option Flows Can Influence Spot Prices
One fascinating aspect of FX options is that large option positions can actually exert a push-pull effect on the spot market. This happens primarily through a mechanism called delta hedging. Here's the gist:
Dealers (usually large banks) often take the opposite side of customer option trades. If a hedge fund buys a bunch of USD/JPY call options from a dealer, the dealer is effectively short those calls. To manage risk, the dealer will typically hedge by buying some USD/JPY spot (or forwards) to offset the delta risk (the directional exposure) of the calls they sold. The amount to hedge (hedge ratio) changes as the market moves and as time passes, because the option's delta changes.
When an option is near its expiry and the spot price is near the option's strike, the dealer's hedging flows can create a magnetic effect on the spot price. For instance, if there's a huge EUR/USD option at 1.2000 strike expiring today, and the market is around 1.1980, the option sellers will buy EUR/USD as it dips below 1.2000 (to reduce their short option delta exposure) and sell as it goes above 1.2000. This tug-of-war can pin the spot rate near 1.2000 until expiry passes, because the dealers are essentially buying low and selling high around that strike to stay hedged. This is often called "pinning" or "gamma gravity" around large strikes.
Barrier options can have an even sharper effect. If a big knock-out barrier is near - say USD/JPY has a knock-out call with a barrier at 110.00 - option holders and dealers have a vested interest in that level not breaking (or breaking, depending on their position). You might see the spot market stall around 109.90 as those with exposure defend the barrier by selling USD/JPY to prevent it from rising and triggering the knock-out. Conversely, if the market sniffs out a barrier and has momentum, it might push hard to trigger it, knowing a flood of orders could come (like the barrier option getting knocked out leading to the option buyer suddenly needing to buy USD/JPY, or a knock-in option being activated prompting hedging flows).
The net effect is that the options market and the spot market are intertwined. Traders keep an eye on known large expiries (many financial news sources and brokerages publish daily lists of big option strikes coming due) as well as rumoured barrier levels. It's not that options dictate the overall trend, but they can influence short-term price action and intraday volatility. For someone trading spot FX, being aware of these option-related forces can be the difference between a perplexing whipsaw and an anticipated temporary stall around a key level.
FX Volatility: Realised vs. Implied
Volatility is the heartbeat of any financial market, and FX is no exception. Some currency pairs (like major ones) often have periods of calm trading in tight ranges, while others (or those same pairs during a crisis) can swing wildly. In FX, we talk about volatility in two main ways: realised volatility and implied volatility.
Realised volatility (aka historical volatility) is a measure of how much the exchange rate has actually been moving over a past period. For example, you might calculate that over the past month, GBP/USD moved with an annualised volatility of 8% (meaning if that level of day-to-day variability kept up for a year, the standard deviation of returns would be 8%). Traders look at realised volatility to understand how turbulent a market has been. If a pair that usually barely budges suddenly starts making big swings every day, realised volatility is rising.
Implied volatility, on the other hand, is derived from option prices and reflects the market's expectation of how volatile the currency will be in the future. When traders buy options expecting big moves (perhaps there's an election or central bank meeting coming up), they bid up the option prices, which in turn means higher implied volatility. Each option has an implied volatility number, and traders often quote "implieds" for standard maturities as a shorthand for how hot or cold the market feels. For instance, if someone says "1-month EUR/USD implied vol is 7%", that means the options market is pricing in roughly a 7% annualised volatility for EUR/USD over the next month.
The relationship between realised and implied is dynamic. Often, implied vol is above realised vol – option sellers demand a premium for uncertainty, so implied tends to trade a bit higher than what has been realised, on average. But if realised volatility is low and steady, implied may drift down as well, especially if there's no obvious catalyst for turmoil on the horizon. Conversely, if realised volatility starts picking up or a major event looms (like a referendum or a geopolitical flare-up), implied volatility can shoot up in anticipation. If implied vol is much higher than realised and you believe the market is overestimating future moves, that could be an opportunity to sell volatility (for example, sell options or use strategies that benefit if the market stays calmer than expected). If implied is too low relative to risks you foresee, you might want to buy volatility (purchase options) relatively cheaply before the market wakes up.
Volatility has a direct impact on how one should approach the market. In high-volatility environments, things change fast: support and resistance levels can break quickly, and trades need more room (wider stops, smaller position sizes perhaps) to account for bigger swings. Options become more expensive in volatile times (since the chance of an option ending up in-the-money is higher), which can affect hedging costs for businesses and the strategies of traders (vol sellers may step in to collect the high premiums, but with the risk that moves remain large).
In low-volatility environments, trading can feel like watching paint dry – until it isn't. Periods of low FX volatility often lull traders into a sense of security, and strategies like carry trades (which I’ll discuss next) become popular under the assumption that exchange rates won't move enough to erase the yield gains. But one must be careful: volatility is cyclical. It can explode from low levels when you least expect it (the classic "calm before the storm"). Having a handle on volatility – both what the market expects and what is actually happening – is crucial for risk management. It influences how much one should leverage, how wide to set targets and stops, and even which currency pairs to play in (some traders love the steady slow moves of, say, EUR/CHF when volatility is low, while others seek out the action in something like GBP/JPY when volatility is spiking).
To sum up, realised volatility tells us how wild the ride has been, and implied volatility is the market’s collective guess at how wild it's going to be. Savvy FX traders watch both. They adjust their strategies to the volatility regime: when the waves get bigger, tighten your life jacket; when the sea is flat, don't assume it'll stay that way forever. Often, the best opportunities arise when the market's volatility expectations are out of line with what you think will happen (and you position accordingly by using or avoiding options, adjusting trade size, etc.).

The Carry Trade: Yield, Volatility, and Risk Sentiment
If you’ve ever heard traders talk about "carry" in FX, they’re referring to the interest rate differential between two currencies. A carry trade is one of the oldest strategies in the book: you borrow (or sell) a currency with a low interest rate, and use those funds to buy a currency with a higher interest rate. While you hold that position, you earn the interest rate differential. It's like getting paid a daily interest for holding the trade. Sounds easy, right? The catch is the exchange rate can move, and adverse moves can wipe out many months of interest gains in a hurry.
How carry works: Suppose the interest rate in Country A is 1% and in Country B it's 5%. If you borrow in A’s currency and invest in B’s currency, you'd earn roughly a 4% annual interest carry (minus any financing costs). In FX terms, this could mean selling currency A against B (short A/long B). One classic example has been the JPY (Japanese yen) carry trade: Japan had near-zero rates for a long time, so yen was a popular currency to borrow/sell. Traders would use yen to buy higher-yielding currencies like the Australian dollar (AUD) or Turkish lira or Brazilian real, which had much higher interest rates. As long as AUD/JPY or TRY/JPY stayed stable or went up (meaning the yen stayed weak), the trader not only gains on the exchange rate movement but also pockets the interest rate spread.
Volatility is the enemy of carry: The ideal scenario for a carry trade is a sleepy market where exchange rates don’t move much (or move in your favour gradually) and you just quietly collect interest. The nightmare scenario is a spike in volatility that sends the high-yield currency plunging. In a market panic or risk-off event, those "funding currencies" like JPY or CHF (which were borrowed/shorted) tend to strengthen as everyone reverses their trades (buying back the yen they borrowed, which pushes yen up). Meanwhile, the high-yield currencies often fall as money floods out. This can cause sudden, large losses for carry trades - often much larger than the interest you earned.
Why do carry trades get unwound when volatility hits? It's largely about risk sentiment. High interest rates often come with higher risk (why else would investors demand a higher yield?). When investors are confident and optimistic (risk-on sentiment), they're willing to take that risk for the extra yield - so they pile into carry trades. This in itself can prop up the high-yielding currencies further (so it can become a self-reinforcing trade for a while). But when fear strikes (global recession fears, financial crisis, geopolitical shock), those same investors rush for cover. They don't want exposure to the risky currency anymore; they buy back the safe currency they borrowed. This herd behaviour causes what’s often called a "carry trade unwind" or "risk-off" rally in the funding currencies.
A hallmark of carry trade strategies is the skewed risk profile: many small gains (interest accrual and maybe some gradual appreciation) and occasional big losses (sharp drops in the target currency). It's sometimes analogised to "picking up pennies in front of a steamroller." That said, carry trades can be very profitable for long stretches. Some traders enhance carry trades by using leverage, but one must be extremely cautious doing so, because leverage plus a volatile unwinding equals a quick blowout if you're not prepared.
Carry and volatility have an inverse relationship in many cases: when volatility is low, carry strategies tend to flourish; when volatility spikes, carry crashes. Understanding this relationship helps traders position accordingly. If you expect a calm period with supportive central bank policies and global growth, carry might be a strategy to employ. If you see storm clouds (e.g., aggressive Fed tightening, geopolitical tensions), it might be time to lighten up carry trades or even reverse them.
It's also worth noting that the landscape of interest rates changes. In the late 2010s, many major currencies had near-zero rates, so traditional G7 carry trades were less appealing - traders looked to emerging markets for carry. But by the mid-2020s, interest rate differentials even among major economies widened again (for example, the U.S. dollar with higher rates vs the euro or yen). This brought back interest in major-currency carry trades. Regardless of the environment, the principles remain: chase yield when it's safe to do so, and be cautious of volatility-triggered reversals. I think the 2020s hiking cycle was quite unique as you had all major CBs hiking thus you could trade the curve (who was going to hike higher and faster).
What Is a Currency Really Worth? PPP, Real Exchange Rates, and Trade Indices
When we see an exchange rate (like USD/INR = 80, or EUR/USD = 1.10), that’s the nominal rate: how many units of one currency you get for one unit of another. But economists and savvy FX analysts often ask, "Is that currency cheap or expensive relative to some fundamental value?" To answer that, they use concepts like Purchasing Power Parity and real effective exchange rates. These tools go beyond the market price to gauge a currency’s valuation.
Purchasing Power Parity (PPP): PPP is a theoretical exchange rate at which the price of a standard basket of goods would be the same in two countries. In other words, 1 unit of currency A should buy the same amount of goods in country A as, when converted into currency B, it would buy in country B, if the exchange rate is at the PPP level. It’s based on the "law of one price" - identical goods should cost the same in different countries when expressed in a common currency, assuming no trade frictions. In practice, PPP is more of a long-term anchor than a short-term predictor. Prices of goods and services can differ a lot across countries due to wages, productivity, taxes, and local preferences.
A fun example of PPP in action is the Big Mac Index (Link) popularised by The Economist. They compare the price of a McDonald’s Big Mac in different countries (converted to USD). If a Big Mac costs $5 in the US and the equivalent of $3 in India, PPP would suggest the Indian rupee might be undervalued relative to the dollar (because with $5 you could buy more burgers in India). However, there are many reasons for such differences (lower labour costs, different demand, etc.), so one should not take PPP as gospel for trading. It does, however, offer a sense of whether a currency is extremely out of line with others in terms of local purchasing power.
Real Effective Exchange Rate (REER): While PPP compares price levels between two countries, the real effective exchange rate takes a broader approach. "Effective exchange rate" means a weighted average of a currency against a basket of other currencies (weights typically based on trade volumes with each partner). The "real" part means it’s adjusted for inflation differentials between countries. REER is a measure of a country’s currency value relative to its trading partners, adjusted for how prices have changed over time. If Country X’s currency has appreciated a lot but Country X also had higher inflation than its partners, the REER might show that in real terms (taking inflation out of the picture), the currency’s gain isn’t as big as it looks nominally.
REER is often used by policymakers and economists to judge competitiveness. If a country’s REER is very high relative to its own history, its goods might be expensive on the world market, potentially hurting exports (the currency might be termed "overvalued"). Conversely, a very low REER suggests a currency is "undervalued" - the country’s goods are cheap for the world, which might boost exports. International bodies like the IMF look at REER to assess if a country’s currency is misaligned with fundamentals. For traders, shifts in REER can sometimes hint at longer-term pressure on a currency (e.g., if a currency is extremely overvalued on a REER basis, there may be political or market forces eventually to correct it, via either depreciation or lower inflation relative to others).
Real world example: Consider the Turkish lira since 2018. Nominally, USD/TRY exploded higher, the lira lost over 80% of its value against the dollar in just a few years. But Turkey was also running extremely high inflation, often in the double digits. So, while the nominal exchange rate showed a significant depreciation, the REER (which adjusts for inflation) fell by a lesser amount. At various points, the REER even showed the lira reverting higher in real terms, not because the exchange rate was improving but because Turkish prices were rising so fast that they offset the currency weakness. For policymakers and traders, this highlights a key point: a weak nominal exchange rate doesn’t always mean competitiveness is improving. If inflation is running hotter than your peers, real depreciation can stall and export benefits may not materialise the way you’d expect.
Trade-Weighted Indices: A simpler cousin of the REER is the nominal effective exchange rate (NEER), often just called a trade-weighted index. Many central banks publish a trade-weighted currency index. For instance, the U.S. Federal Reserve has a trade-weighted dollar index, and the Bank of England has a trade-weighted pound index. These indices combine the exchange rates of a country’s major trading partners, weighted by trade share, to show an overall performance of the currency. Unlike REER, they might not adjust for inflation – so they’re "nominal" indices. They are useful to see the big picture: a currency might weaken against the dollar but strengthen against others; the trade-weighted index tells you if on average it’s up or down.
For example, if the euro weakens a lot against the dollar but not much against other currencies, the trade-weighted euro might only be slightly down. If you're only watching EUR/USD, you might think the euro is very weak, but from the euro area’s perspective, their currency might be doing okay against the broader basket. Conversely, a currency can quietly become very strong in trade-weighted terms even if its move against the U.S. dollar is modest, if it’s been climbing versus many other currencies.
In practical FX trading, PPP and REER are not things you trade off on a day-to-day basis. They are more like background information. A long-term investor or an economist might use them to argue that a currency is due to appreciate or depreciate over time. A hedge fund might look at extremes – say, a currency is 30% undervalued by PPP and fundamentals are improving; that could support a long-term bullish position. But short-term traders usually focus more on momentum, interest rates, and flows. Still, understanding these concepts helps round out your view of the FX landscape. It reminds us that beyond the immediate market price, there’s a fundamental "gravity" that eventually can pull currencies toward levels justified by economy-wide factors (though that pull can take years and is often superseded by more immediate concerns).
Emerging Market FX: High Rewards, High Risks, and Different Dynamics
Not all currencies behave like the major ones (USD, EUR, JPY, GBP, etc.). Emerging market (EM) currencies add another layer of complexity. They can offer tantalizingly high interest rates (making for juicy carry trades) and sometimes dramatic trends, but they also carry unique risks. Let’s explore what drives EM FX and how it differs from developed market FX:
Drivers of EM Currencies: Many of the factors that move major currencies also apply to EM: interest rate differentials, capital flows, and central bank policies all matter. However, EM currencies are often more sensitive to certain things:
Commodity Prices: A lot of emerging economies are commodity exporters. For example, the Mexican peso (MXN) tends to strengthen when oil prices are high (Mexico is an oil exporter) and weaken when oil prices slump. The Russian ruble (RUB) similarly tracks energy prices, and the Chilean peso (CLP) correlates with copper prices. This means external commodity cycles can drive EM FX big time.
Global Risk Appetite: EM currencies often act as a barometer for global risk sentiment. When investors are optimistic and seeking higher returns, they pour money into emerging markets (both stocks and bonds), which supports EM currencies. But in a risk-off scenario, EM currencies are usually the first to get hit as foreign investors rush out. You might see a broad EM FX selloff if, say, the U.S. Federal Reserve signals sharply higher rates (drawing money back to safe assets) or if there's a geopolitical scare. Think of EM FX as a higher-beta play on global markets.
Local Politics and Policy: Political risk is a big differentiator. An election, policy change, or even a hint of instability can send an EM currency into a tailspin in ways that rarely happen with, say, the Swiss franc. For instance, if a country elects a government that markets perceive as fiscally irresponsible or likely to interfere with the central bank, the currency might drop sharply. Examples abound: the Turkish lira (TRY) has often reacted violently to unconventional monetary policies and political interference with its central bank; the Brazilian real (BRL) has swung on corruption scandals and election results.
External Debt and Deficits: Many EM countries rely on foreign borrowing (often in USD or EUR). If a country has a large external debt or a big current account deficit (importing more than it exports, financed by capital inflows), its currency can be vulnerable. Why? Because it depends on continuous inflows of foreign capital. If those dry up (say global conditions change or investors lose confidence), the currency may devalue to adjust. We saw this in episodes like the Asian Financial Crisis of 1997, where currencies like the Thai baht collapsed under the weight of external debts and evaporating investor confidence.
Risks and Structural Differences:
Higher Volatility: EM FX is generally more volatile than developed FX. Daily swings of 1-2% (which are huge for something like EUR/USD) might be routine for, say, the South African rand (ZAR) or Turkish lira. Wider spreads and gaps in price can occur, especially in off-hours or during crises.
Liquidity and Market Access: Major currencies trade 24/7 with deep liquidity. EM currencies can have thinner trading outside their local market hours, and some are not freely traded at all. For example, the Indian rupee (INR) or the Indonesian rupiah (IDR) have capital controls; you can't just trade unlimited amounts of them offshore. This has led to NDFs (Non-Deliverable Forwards) for some currencies – basically forward contracts that settle in dollars because the local currency isn't freely deliverable offshore. NDF markets (for currencies like INR, Brazilian real (BRL), Chinese yuan (CNY) via its offshore variant CNH, etc.) allow hedging and speculating when direct access is restricted.
Intervention and Pegs: EM central banks are often very active in their currency markets. They might intervene (buying or selling FX reserves) to stabilise their currency if it's swinging too wildly or to counter speculative attacks. Some maintain pegs or bands. For instance, several Gulf countries peg their currencies to the U.S. dollar. China manages the yuan with a daily reference rate and a trading band (a "dirty float"). These regimes mean the market might price in political risk - if a peg looks unsustainable, speculators might challenge it. A famous case was the Argentine peso, which had a 1-to-1 USD peg in the 1990s before collapsing in 2001, causing a huge devaluation.
Carry and Inflation: EM currencies often have high interest rates because they often have higher inflation. That means they can depreciate over time if inflation erodes their value. An 8% interest rate might come with 6-7% inflation, netting out a modest real yield. But if you catch an EM currency during a period of improving fundamentals (inflation falling, reforms happening), you might get the double win of high carry and appreciation as investor confidence builds. Conversely, when inflation gets out of hand (like in Argentina or Turkey at times), the currency’s value can plummet rapidly despite sky-high interest rates, as locals and foreigners alike dump it for more stable stores of value.
For traders and investors, EM FX can be rewarding but requires caution. It's important to stay informed about local developments (politics, central bank decisions, geopolitical events) and global factors like commodity trends and U.S. monetary policy (since a lot of EM financing is in dollars, a strong USD or rising U.S. rates can hurt EMs). Position sizing often needs to be more conservative given the volatility. Also, be aware of liquidity – during a crisis, you might find it hard to exit a position at a reasonable price.
On the flip side, understanding EM currencies can provide opportunities for diversification. They don't always move in sync with major currency pairs; their drivers can be quite idiosyncratic. And for those willing to dive into the details, mispricings due to fear or misunderstanding can be exploited (with care). Just remember, the rules of the game can differ markedly from the familiar terrain of major FX pairs.

The Institutional Perspective: Liquidity, Order Flow, and Seasonal Patterns
Professional FX traders and institutions often have a somewhat different perspective from a retail trader sitting at a laptop. While the fundamentals and concepts are the same, the focus on when and how to trade can be very refined. Let's peek into some institutional considerations:
Market Liquidity and Time-of-Day Patterns
Liquidity in FX isn’t static; it ebbs and flows throughout the day as different financial centres open and close. The FX market operates 24 hours a day during the week, but it's not uniformly active all the time. Generally, London is the largest FX trading centre, and when London and New York hours overlap, liquidity is at its peak. This roughly covers 8 a.m. to 12 p.m. New York time (1 p.m. to 5 p.m. London time). During this window, you often see the tightest spreads and the capacity to transact large amounts with minimal slippage.
In contrast, late New York afternoon into the Asian early morning (say 5 p.m. to 7 p.m. New York, which is after New York closes and before Tokyo fully opens) is typically the least liquid period. Major market-moving news is unlikely to be released then, and many large players are offline. If a big order hits during that lull (perhaps from an asset manager reallocating or an unexpected news event), the market can move sharply due to thinner liquidity. It's not uncommon to see a currency pair "gap" when the new week opens on Monday morning in Asia if significant news broke over the weekend, precisely because trading resumed when fewer participants were active to buffer the move.
Certain currencies might be more active in particular sessions. For instance, the Japanese yen often has pronounced moves during the Tokyo session because that’s when local players (like the Bank of Japan or Japanese institutions) are active. The euro and pound see most action in the European and early U.S. sessions. That said, major pairs can and do move at any hour if the news or flows are significant enough.
Another time-of-day factor is the daily fixings. One well-known example is the WM/R London 4 p.m. fix. Many large institutions and funds use that fixed exchange rate (computed from market rates around 4 p.m. London) to benchmark their portfolio valuations. This means if a fund needs to do currency conversion (like converting overseas investment returns or rebalancing allocations) as of end-of-day, they might trade around that time to match the fix. On days with large fixing orders (say, a lot of people need to buy euros and sell dollars at the fix), the market can swing in the minutes before 4 p.m., then often snap back after the fix passes.
Finally, note that around 5 p.m. New York time (the "end of day" for FX), many trading platforms widen spreads or have a brief downtime to settle the day’s trades and roll positions. If you’re trading around that time, don’t be surprised by some odd price action or temporary illiquidity.

Order Flow and Positioning
Order flow refers to the actual buy and sell orders coming into the market. While retail traders see price charts, institutional traders often also gauge the market by who is buying or selling. For instance, consistent buying of a currency by what appears to be central bank or sovereign wealth fund flows might put a floor under that currency. Heavy selling by macro hedge funds could signal a big shift in sentiment. Banks that deal in FX have a pulse on this, as they see their clients' orders (corporations, funds, governments). Sometimes, you'll hear things like "there was strong corporate demand for dollars today around the fix" or "real money accounts were selling euros this morning," which can help explain a move or hint at who’s behind it.
Related to order flow is positioning. The idea here is: if the market is collectively positioned very one-sidedly, it can be vulnerable to a reversal. One way to track this is through the CFTC’s Commitment of Traders (COT) report for currency futures, which gives a glimpse of how speculators are positioned (long or short) in certain major currencies. If, say, that report shows an extreme net long position in the dollar, it might be a caution sign that if any news goes against the dollar, a lot of traders might head for the exit at once (since they're all on the same side of the boat). Similarly, analysts use data from research desks, prime brokers or surveys to infer when trades are crowded.
Positioning analysis played a role in events like the sharp drop in the U.S. dollar in early 2018 - many traders were short the dollar at the time (betting on its decline), and when it bounced, it turned into a scramble to cover shorts, fuelling a larger rally. As a trader, it's useful to have a sense of popular consensus trades and whether you're aligned with or against a crowded position.
Seasonal and Calendar Effects
Markets, including FX, can exhibit seasonal patterns. These aren’t ironclad rules but statistical tendencies. For example, some studies have noted that the British pound (GBP) often shows strength in April – possibly related to UK corporations repatriating earnings before the tax year-end. The U.S. dollar has sometimes shown a tendency to strengthen late in the year, perhaps as global companies and investors adjust holdings before closing books (or due to liquidity drying up and the dollar being a safe haven). The Japanese yen has occasionally strengthened in March, which is Japan’s fiscal year-end, as Japanese firms bring money home.
Another recurring pattern is holiday-thin liquidity. Late December around Christmas and New Year, many markets are half-open at best, and FX can get very quiet – unless an unexpected event hits, in which case the moves might be exaggerated due to fewer traders on duty. Similarly, the summer months (especially August) can be slower in terms of market participation (particularly in Europe), but again, if something big happens (like surprise central bank action), the low liquidity can make for outsized jumps.
One also hears about the "sell in May and go away" adage from stock markets potentially affecting FX, especially for currencies tied to global growth and risk appetite. If equity investors reduce exposure in May, currencies like AUD or emerging market FX might see some seasonal softness. Moreover, large investment funds often rebalance their portfolios monthly or quarterly, which can lead to end-of-month or end-of-quarter currency flows. For example, if U.S. stocks greatly outperformed European stocks in a quarter, some funds might sell a bit of U.S. equity and buy European equity to rebalance, which involves selling dollars and buying euros towards quarter-end.
As with any seasonal pattern, these are tendencies, not guarantees. Their real usefulness is when they align with other factors – for instance, if you know there's often dollar strength in December and you also see a bullish dollar fundamental setup, you might have extra confidence in a year-end dollar long. Institutions love to be aware of these patterns, because every little edge or forewarning helps in the zero-sum game of trading.
Central Bank Power: Pegs, Interventions, and Manipulation
While free-market forces drive currencies most of the time, governments and central banks can and do step in to influence exchange rates. Understanding the policy regime for a currency (free float, managed float, or fixed peg) and the possibility of intervention is crucial, especially for those trading that currency. Let's unpack this:
Fixed vs. Floating vs. Dirty Float: A currency regime can range from a strict peg to a free float. A fixed peg is when a country locks its currency’s value to another currency or a basket of currencies. For example, Hong Kong pegs the Hong Kong dollar to the U.S. dollar at around 7.8 HKD per 1 USD, allowing only a tiny band of fluctuation. To maintain that, the Hong Kong Monetary Authority actively intervenes by buying or selling USD/HKD whenever the rate threatens to move out of its band. A free float is what major currencies like USD, EUR, JPY ostensibly have – their value is determined by market supply and demand, with no explicit target level (though even then, central banks might occasionally step in during extreme situations). In between is the managed float (often nicknamed a "dirty float"), where a currency mostly trades by market forces, but the central bank might intervene or use other tools to nudge it when needed. Many emerging markets adopt this approach: they don’t promise a fixed rate, but if their currency is gyrating wildly or moving too far, they will step in.
Why intervene? Central banks intervene in FX for several reasons:
To stabilise the currency during turmoil. A rapidly falling currency can spark inflation (since imports get expensive) and panic, so a central bank might sell foreign reserves to buy its currency and prop it up.
To maintain a competitive exchange rate for exports. Some export-driven economies want to prevent their currency from getting too strong, as that could hurt their industries. In the past, countries like China were accused of keeping their currency undervalued to boost exports.
To meet an official target or peg. If you have a declared peg (like those Gulf countries pegged to USD), you must intervene to maintain it whenever market pressure tries to move the rate.
To smooth excessive volatility. Even without a specific target, a central bank might not want to see huge swings in the currency that could disrupt business planning. So they may step in occasionally to calm things down (buying or selling currency to counteract speculators).
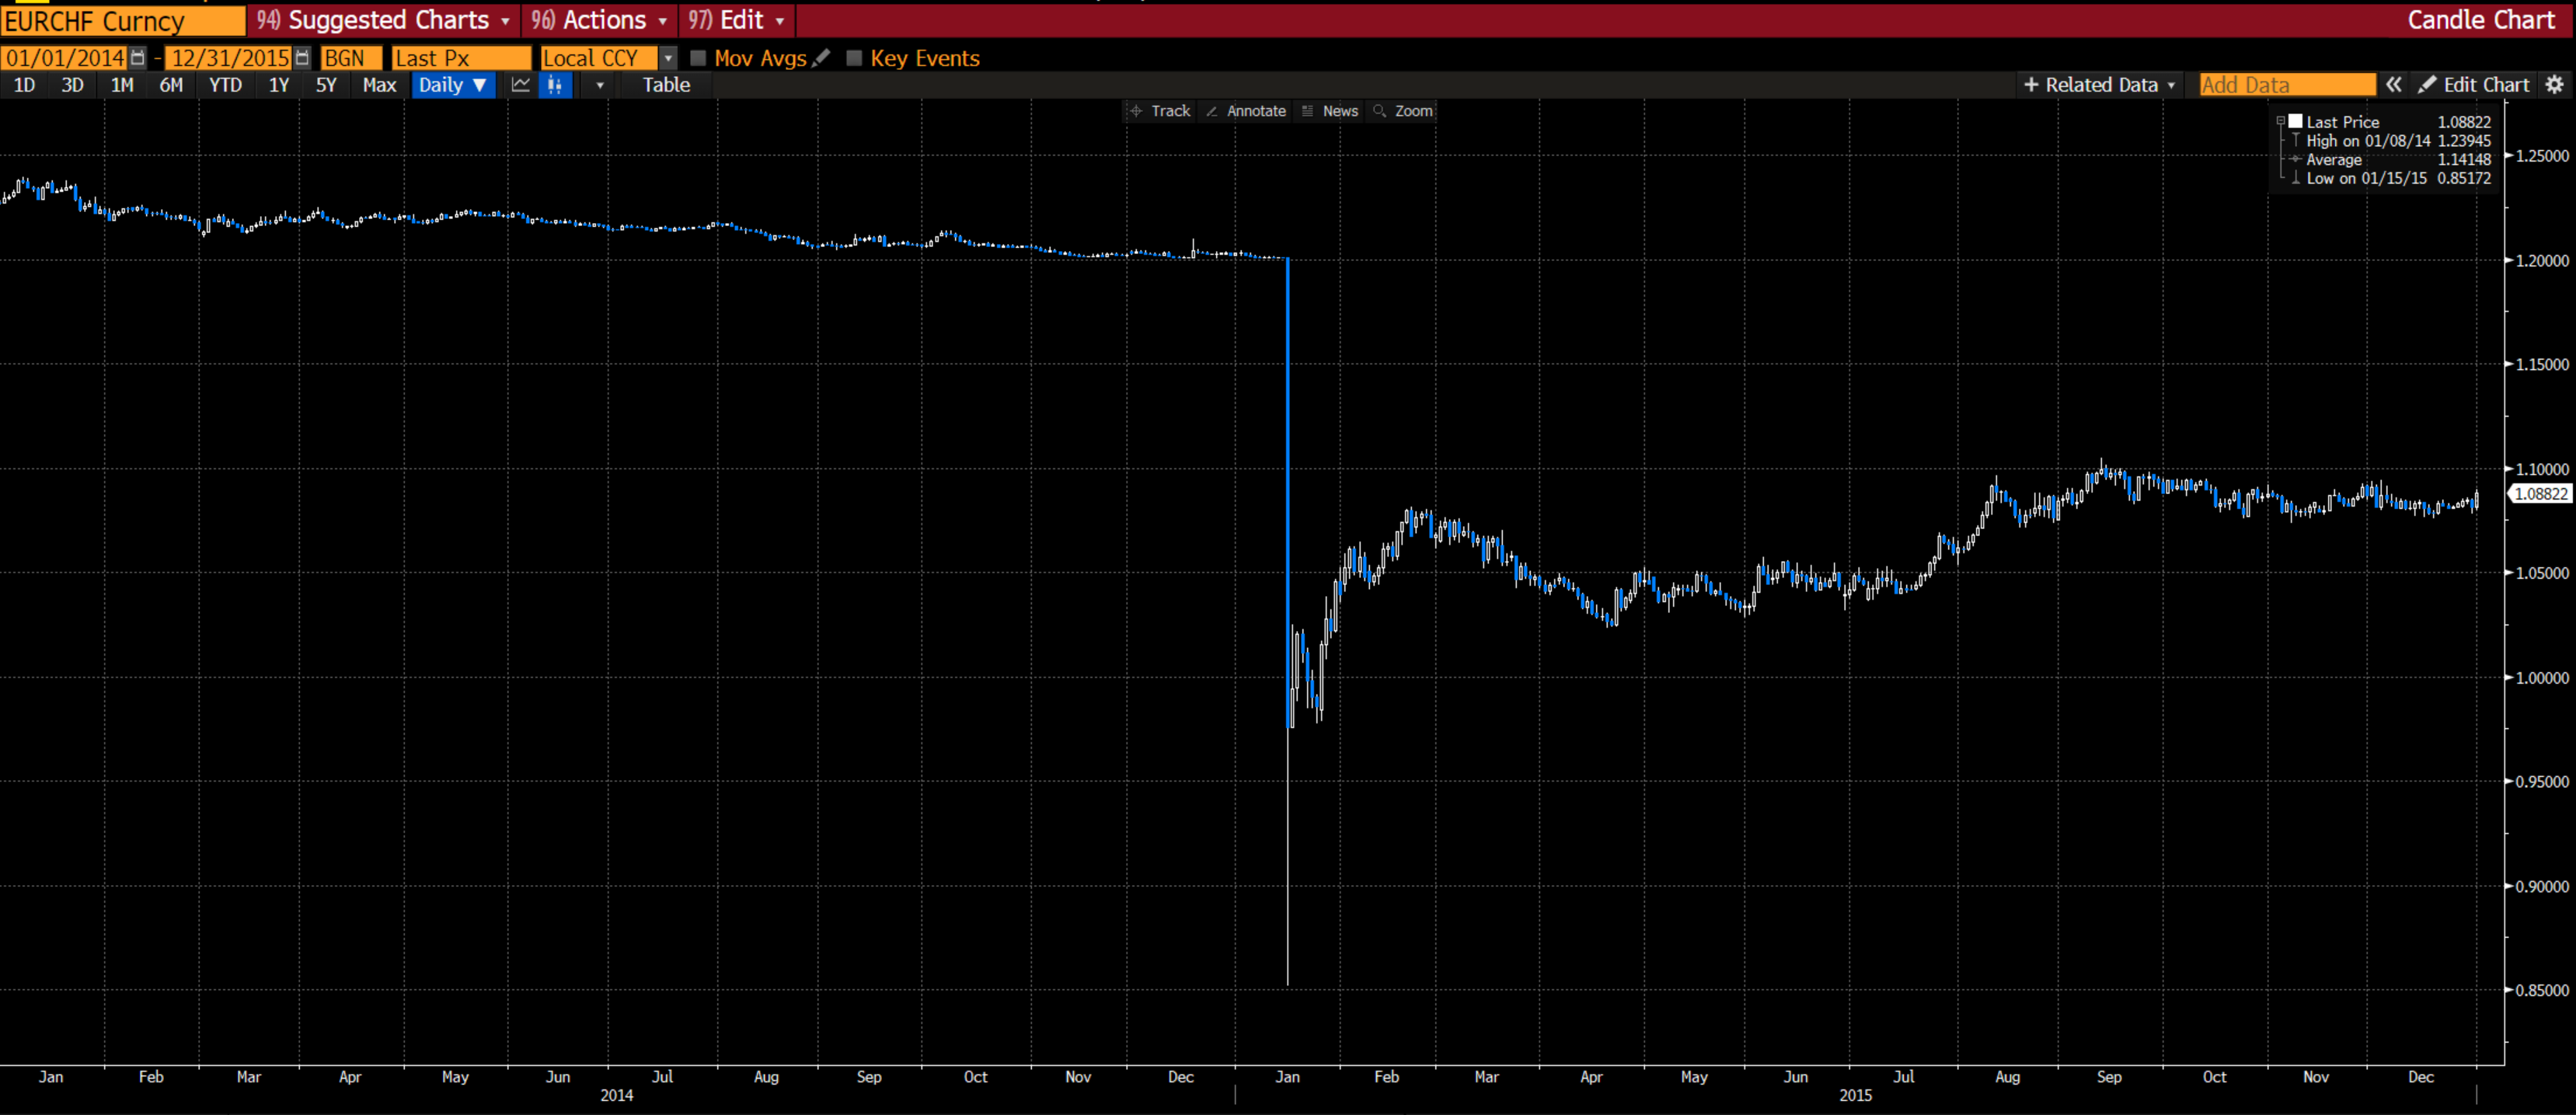
Tools of intervention: The most direct tool is for the central bank to buy or sell currencies using its reserves. For example, if the central bank wants to strengthen its currency, it will sell foreign reserves (like U.S. dollars) and buy its own currency in the market, thereby increasing demand for its currency. Some interventions are sterilised (offsetting the impact on domestic money supply) and some are not. Additionally, central banks can use interest rates as an indirect tool (raising rates to defend a weak currency, as higher rates may attract capital). Extreme measures include capital controls (making it hard or illegal to trade the currency freely across borders) or changing regulations to discourage speculation. In 1998, Malaysia famously imposed capital controls to stop the ringgit's decline during the Asian crisis. In 2015, Switzerland suddenly scrapped its euro peg after spending enormous sums to defend it, causing a one-day 20% jump in the franc once they let it go.
Manipulation vs. Policy: The word "currency manipulation" often comes with a negative connotation – typically used when a country is seen as deliberately holding its currency too low for trade advantage. The U.S. Treasury even maintains a watchlist of countries for this. However, there's a thin line between "prudent management" and "manipulation". From one perspective, any intervention could be seen as manipulation, but from another, it's just policy. For instance, during the 2010s, many countries eased monetary policy (which indirectly weakens their currencies) to boost growth and avoid deflation. Some dubbed this a "currency war" – implying everyone was trying to devalue for their own gain. In truth, domestic economic goals and FX values are intertwined.
For traders, the key is to know what regime you're dealing with and to respect the central bank. Fighting a central bank’s stated objective can be perilous (the classic line is "Don’t fight the Fed," applicable to any central bank really). Yet, there are times when pegs break and interventions fail – often spectacularly. The most legendary example is the Bank of England vs. George Soros in 1992. Britain was trying to prop up the pound within the European Exchange Rate Mechanism (an early system of semi-pegs), but market forces, led by massive short-selling from Soros and others, overwhelmed the BoE’s interventions. Britain had to abandon the peg (on Black Wednesday), and Soros’s fund famously made around a billion dollars betting against the pound.
More recently, in 2022, the Bank of Japan intervened to strengthen the yen for the first time in decades when USD/JPY surged to multi-decade highs (the yen was very weak due to a policy divergence with other countries hiking rates). The intervention caused a sharp drop in USD/JPY (yen suddenly stronger) intraday. It signaled to the market that there was a line in the sand, at least for a time. Traders who were long USD/JPY suddenly found themselves facing a central bank on the other side.
In summary, always be aware of the policy backdrop. Is the currency you're trading managed? Does the central bank have a track record of stepping in? Are there key levels (often publicly known or speculated) where intervention might kick in? Being blindsided by an intervention can be painful if you're on the wrong side. On the flip side, if you anticipate or recognise one happening, it can present trading opportunities (like riding a central bank-driven move, or knowing when not to chase a move too far). FX isn't a free-for-all; the referees (central banks) can, and do, sometimes change the course of the game.
Beyond Basics: Cross-Currency Basis and Other Quirks
For our final deep dive, let's touch on a couple of the more technical or subtle aspects of the FX world that often don't get front-page attention but are very important in the plumbing of international finance. In particular: cross-currency basis and some notes on correlations and trade mechanics.
Cross-Currency Basis
This concept can sound intimidating, but it essentially boils down to mismatches between interest rates and FX rates that shouldn't exist in theory, yet do in practice. Under ideal conditions (textbook finance), borrowing in one currency and swapping it to another should end up costing you roughly the interest rate of the second currency (thanks to forward rates adjusting for interest differentials). However, in the real world, there are sometimes imbalances: maybe everyone wants to borrow in dollars and lend in euros, or vice versa. These imbalances show up as a basis in the FX swap market.
The cross-currency basis is usually quoted in terms of "basis points (bps)" that one side has to pay or receive to make the swap fair. For example, if there is a 20 basis point USD/EUR basis, it might mean that swapping euros into dollars via an FX swap yields an effective interest rate 0.20% different than what you’d get just borrowing dollars outright. If it’s negative, it implies an extra cost to swap into dollars (i.e., high demand for dollars via swaps).
This might sound arcane, but it has practical implications. During crises, the cross-currency basis for USD tends to go very negative for many currency pairs, meaning people are willing to pay a premium to get USD liquidity. We saw this in 2008 and again in early 2020: companies and banks worldwide rushed for dollar funding, and those without direct access to dollars had to use FX swaps and paid up for the privilege (widening the basis). Central bank swap lines (like the Fed providing dollars to other central banks in exchange for local currency collateral) are a tool to alleviate this stress.
For a more normal example: A Japanese investor might want to buy a U.S. bond but hedge the currency risk back to yen. The cost of that hedge will depend on the interest rate differential and the cross-currency basis. If the basis moves, it can make hedged foreign investments more or less attractive. Thus, big moves in cross-currency basis can influence capital flows and investment decisions, even if subtly.
In recent years, the basis - especially for major currencies like EUR/USD or USD/JPY - became persistently non-zero, partly due to regulatory changes and structural demand for certain currencies. Traders, of course, seek to arbitrage or trade these differences, and now there are even futures contracts based on cross-currency basis indices for those who want to speculate or hedge that mismatch.
Tom/Next (Tomorrow-Next) Mechanics
Earlier we mentioned how spot FX trades settle in T+2 days, and how rolling a position involves a tiny FX swap (called a Tom/Next swap). Let’s explain that a bit more. If you hold a spot FX position and don’t want to take delivery, your broker will typically do a tom/next swap: simultaneously close your position for tomorrow and reopen it for the next day. This usually comes with a small financing cost or gain, reflective of the interest rate differential for one day (plus a small spread the broker may take).
When you see a "rollover" charge or credit in your FX account, that's the tom/next in action. If you’re long the currency with the higher interest rate (and short the one with the lower rate), you likely get a small interest payment each day for holding (positive roll). If you’re on the opposite side, you'll pay a little (negative roll). These can add up over time, especially if you hold for long periods. It's basically the carry trade at work on a day-by-day basis.
For institutional players, tom/next and similar very short-dated swaps are how they manage short-term funding and positions. For example, if a bank is short of yen for a day, they might do a one-day swap to get yen now and pay it back tomorrow. The tom/next rates can sometimes spike around quarter-end or year-end when banks are tidying up balance sheets (and demand for certain currencies might jump). You might have heard of “turn-of-year” effects in money markets; they can reflect in FX swap pricing too.
Correlations in FX
Last but not least, a quick note on correlations. Currencies do not move in isolation. There are common patterns and relationships:
Safe havens (tend to) move together: In risk-off scenarios, currencies like the Japanese yen and Swiss franc often strengthen in tandem, while pro-growth currencies (like AUD, NZD, or many EM currencies) fall. So JPY and CHF often show positive correlation in flights to safety.
Dollar versus the rest: Sometimes, the FX world simplifies to "the USD vs everything else". In a broad dollar bull market, you might see EUR, GBP, AUD, etc. all declining together against USD (so they might be positively correlated with each other, moving opposite to USD). When the dollar is weak, the opposite tends to hold.
Commodity currencies: AUD, CAD, NZD (and others like NOK or ZAR to some extent) often get grouped as commodity currencies. They don't always move in lockstep, but they share common drivers (global growth, commodity price cycles). If oil prices surge, CAD (being tied to oil) might rally; if it's a general commodities boom, AUD and NZD could rally too
Regional ties and pegs: Some currencies are closely tied due to policy or geography. The Swiss franc for a time was semi-pegged to the euro (2011-2015), so EUR/CHF barely moved while that was in place. Hong Kong dollar is pegged to USD, so it correlates 100% with USD (within its tight band). Smaller European currencies like SEK or NOK often move somewhat with the euro due to economic ties.
Funding vs. investing currencies: If yen is a funding currency and, say, the Brazilian real is a popular investment target, you might see yen weakness when BRL is strong and vice versa. In carry trade regimes, funding currencies tend to be correlated with each other (all weak during risk-on) and inversely correlated with the high-yielders.
Watching correlations can help in a few ways. It can inform diversification (no point thinking you're diversified if you go long AUD and CAD, because if the thing you're betting on is a broad commodity rally, they're somewhat similar). It can also give clues when something is off. If one traditionally correlated currency pair suddenly diverges from the others, maybe there's a unique factor at play or an opportunity for a relative trade. For instance, if normally EUR/USD and GBP/USD move together (both reflecting USD strength/weakness), but suddenly the euro is falling and the pound isn’t, perhaps there’s a Euro-specific issue (like an EU political event) – or maybe the pound is lagging and could catch up.
Correlations also remind us that in FX, there’s often a lot of cross-talk with other markets: the link between FX and commodities, or FX and equities/bonds (money flowing into a country’s stock market can lift its currency, etc.). Good FX traders are often macro thinkers, scanning various markets to piece together the puzzle of what’s driving money flows at any given time.
The Final Piece: Building the Trade
We’ve covered everything from policy to positioning - now let me show you how I put it all together.
Below is the checklist I use to turn a macro bias into a real trade idea. It’s not theoretical, it’s how I map, time, and size FX setups. And I’ll walk you through a real USD/CAD trade I gave subscribers last September.
Start big. Where are we in the cycle?
Growth accelerating or decelerating?
Inflation peaking or sticky?
Is monetary policy restrictive enough?
Are we in a liquidity expansion or contraction?
Rates differentials…
Who’s tightening more? Who’s cutting next?
What’s priced into the OIS curve?
Is the forward curve steep or flat?
Are real yields rising or falling?
Flows + positioning
Are speculators max long already?
Are CTAs chasing? Are real money flows going the other way?
Is there a seasonal tilt?
If everyone’s already in the trade, you need a catalyst to take it further… or you fade it...
Vol regime
Is vol rising or compressing?
Is the market hedged or complacent?
Is the trade asymmetric with vol protection?
If implieds are cheap, use options to express the view. If implieds are rich and you need to be precise use spot and cut size.
Catalyst + Timing
Is there a data release, central bank meeting, or geopolitical event coming?
Are you early - or are you already in the unwind?
Is the move slow-grinding or explosive?
Monitor correlations…
Is your trade consistent with equities, rates, and commodities?
Is the move idiosyncratic or part of a broader dollar/risk flow?
Does the cross confirm the view? (e.g. EUR/USD vs EUR/JPY can tell you something about risk appetite vs pure USD strength.)
Sometimes, the best way to play a view is not the obvious pair.
Lastly… Where am I wrong?
What’s priced?
Am I early, late, or just emotional?
If you don’t know who’s on the other side of your trade, you probably are the other side.
How I Use This Framework in Practice
This isn’t just some theoretical checklist I keep in a drawer… it’s how I build actual trades. Here's one I gave to subscribers in Volume 109 of the Week Ahead, Sep 2 2024:
Trade Idea: Long USD/CAD
Entry: ~1.3500 area
Stop: 1.3320
Target: 1.3750Macro bias: Canadian growth was slowing, unemployment was climbing, and the BoC had already opened the door to multiple cuts into year-end. Meanwhile, the U.S. was still outperforming, with no signs of a hard landing - making USD a clean carry and rate divergence play.
Rates: The BoC was expected to cut by 25bps that week (to 4.25%), and market pricing already leaned toward 3.75% by year-end. U.S. rates were sticky. Even with the Fed preparing to cut, the relative pace of easing still favoured the USD.
Positioning: Clean. No one was leaning heavily into long USD/CAD at the time — and CAD wasn’t particularly strong either. Flows were neutral to soft.
Vol regime: Calm. Implieds were subdued. But buying spot made more sense as I couldn’t really grasp how long it would take to work, so I decided not paying up for optionality was the way to go.
Catalyst & timing: Rate divergence was already in play. The BoC cut was widely expected, so not a high-volatility event — but it removed any doubt about the easing cycle. Unless oil ripped, there was limited CAD upside.
Technical: Not the cleanest chart setup. It was mid-range, but macro alignment and carry supported the view. No reason to overthink it.
I’m not trying to say look at me, I called it. I’m just trying to show how the framework forces you to build conviction before you touch the button. It helps me avoid trades where I’ve got the narrative but no edge or where I’m leaning into crowd positioning with no catalyst. You don’t need every box ticked across the board, but if the macro, rates, flow, and vol all line up… it’s probably worth a look.

There’s no shortage of clean macro content out there, but most FX writeups stop short of giving you something you can actually trade around. They explain what moves currencies, but not how to build a view, when to enter, what flow is doing, or how certain options might screw your timing. This post is designed to be different, a working manual for traders, investors, or analysts who wanted both the why and the how.
My hope was to blend institutional insight with retail accessibility. It provides the full picture - from rate differentials and capital flows to microstructure shifts, volatility pricing, and expiry dynamics. Whether you’re long dollars, short yen, watching EUR gamma, or just trying to figure out if you’re early or wrong, this is meant to be the thing you come back to. Not just another explainer like other Substack posts, but something with depth, structure, and real edge.
So that is a wrap on our tour of the FX world - from basic currency drivers to the complex plumbing that keeps global markets flowing. What makes FX so fascinating is how it sits at the crossroads of everything: economics, politics, and raw market psychology. A Bank of Japan decision can shake markets in Brazil within seconds. A single trade war tweet can send safe-haven currencies soaring. And behind it all are the financial instruments that connect markets across continents.
If you're trading from home, I hope this helps you see beyond those EUR/USD charts you've been staring at. There's a whole ecosystem moving those lines on your screen. For the institutional folks, maybe this refresher helps you explain to clients or colleagues why currencies behave the way they do.
What I love about FX is the balance, the adrenaline rush of fast markets combined with the need for thoughtful strategy and healthy respect for risk. Whether you're hedging business exposure, chasing pips for profit, or just trying to understand how global finance works, seeing how these pieces fit together makes all the difference.
One last thing I've learned the hard way: Just when you think you've got currencies figured out, they'll humble you. Stay curious and keep up with macro developments.
As people like to say, "Money never sleeps." FX markets are quite literally that.
Any questions? Drop them in the comments or feel free to reach out to me via DM. If you found this helpful, please feel free to hit the like button and share it with others in your network.
One key lesson I learned being on an FX desk… Barrier flow is rarely your friend, stay alert near key strikes.
Happy trading,
Fed
Great post. I think of currencies like this:
- Major Currencies (Highways and Cities): Major currencies like the USD, EUR, JPY, and GBP are akin to highways connecting major cities. These currencies are widely traded, highly liquid, and the backbone of global trade and finance. As highways facilitate efficient and large-scale transportation between key hubs, major currencies provide stability and reliability in international markets.
- Minor Currencies (Secondary Roads and Towns): Minor or regional currencies like the NZD or SEK are like well-maintained secondary roads connecting smaller towns. They are still crucial for trade within specific regions but lack major currencies' global reach and liquidity.
Exotic Currencies (Village Roads): Exotic currencies like the Iranian rial or Zimbabwean dollar resemble local village roads—narrow, less traveled, and often unreliable. They are less liquid, more volatile, and typically used only within their domestic economies or for niche purposes.
- Currency Strength Indicators (Traffic Flow): Just as traffic flow on highways and roads indicates their usability and importance, currency strength indicators reflect the economic activity and market confidence in a currency. A "jammed highway" might represent a strong currency under stress (e.g., high demand), while an empty village road could signify a weak or underutilized currency.
Your guide is like Waze!
Great post. Just want to add that tom next in EM market(like CNH) sometimes can be very interesting due to CB intervention.